環境放射線量の測定, Measurement of environmental radiation dose
このような核崩壊による放射線量率の時間変化は、実は身近に観察できるのです。2011年3月11日に東日本大震災が発生し、福島第一原子力発電所の原子炉が3基とも炉心溶融を起こし、建物の破壊や放射性気流の外部流出により近郊は強く放射能汚染され居住不可能地域が生じました。[11][12]それだけではなく、空中高く上昇した放射性気流は風に乗って東京方面まで流れました。この時、雨が降った地域には放射性物質が雨と共に落下しました。そのため、福島第一原子力発電所から約200 km離れた千葉県の柏市や茨木県が放射能汚染[13]されました。市内の多くの地点が放射能のホットスポットになった[14]のです。放射能の強さは、これまでの環境放射能とあまり変わらない程度からその100倍ほど強い場所までまちまちです。場所を選んで、長期間にわたり放射線量率の時間依存性の定点観測をすれば、大物理学者のラザフォードと同じ物理の妙味を知ることが出来るのです。この場合、放射能の強さに注意しなければなりません。目安は国際放射線防護委員会(ICRP)勧告の0.23 μSv/hの値[15]です。
In fact, changes over time in the radiation dose rate caused by nuclear decay can be observed closely. The Great East Japan Earthquake occurred on March 11, 2011, and all three reactors at the Fukushima Daiichi Nuclear Power Plant melted down. Buildings were destroyed and radioactive air flowed outside, making the surrounding area highly radioactively contaminated and uninhabitable region has arisen.[11][12] Not only that, but radioactive air currents that rose high into the air were carried by the wind and flowed all the way to Tokyo. At this time, radioactive materials fell with the rain in areas where it rained. As a result, Kashiwa City in Chiba Prefecture and Ibaragi Prefecture, which are approximately 200 km away from the Fukushima Daiichi Nuclear Power Plant, were contaminated with radioactivity.[13] Many points within the city became radioactive hotspots.[14] The strength of radioactivity varies from places where it is not much different from previous environmental radioactivity to places where it is 100 times stronger. If you choose a location and conduct fixed-point observations of the time dependence of radiation dose rates over a long period of time, you will be able to discover the same wonders of physics as the great physicist Rutherford. In this case, you must be careful about the strength of the radioactivity. The guideline is the value of 0.23 μSv/h recommended by the International Commission on Radiological Protection (ICRP)[15].
東京大学環境放射線情報, The environmental radiation information of the University of Tokyo
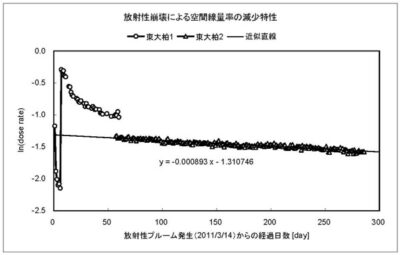
放射線量率の時間依存性の例として、インターネットに公開されている東京大学環境放射線情報[13]のデータを検討してみます。福島第一原子力発電所の第1号機で2011年3月12日15:36水素爆発、第3号機で3月14日11:01水素爆発、第2号機で3月15日06:10すぎ爆発音、と深刻な事態が発生[11][12]しました。東大のデータは2011年3月15日に始まり12月25日に終わっています。線量率の高い柏市のデータには3月15日から5月13日まで(東大柏1)と5月10日から12月25日まで(東大柏2)の2系統あります。そのデータを見ると、3月20日まで約0.12 μSv/hだった値が3月21日に約0.75 μSv/hに急上昇しています。これは、原発から上昇した放射性大気プルームが21日夜から22日未明にかけて茨城沿岸から千葉を通り南下した時、関東地方で雨が降り放射性物質が降下した[17]ためです。東大の測定は1日に数回行われているので日毎の平均を取り、空間線量率(μSv/h単位)の自然対数値と経過日数の関係を図5に示します。東大柏2のデータはほぼ直線なので、近似直線の勾配から崩壊定数は0.000893 [1/day]となり、半減期はln(1/0.000893) = 775.9日となります。
ここで、放射性セシウムと放射性ヨウ素の半減期、崩壊定数、平均寿命(1/λ)を表1に示します[18]。東大柏2のデータから求められた半減期は134Csの半減期753.7日より約22日長いだけで大変近い値です。東大の測定環境では除染などの人為的な線量率減少要因は無いと推定されるので、5月10日から12月25日までの空間線量率の減少は主に134Csの放射性崩壊によると考えられます。
| 同位体 | 半減期[day] | 崩壊定数[1/day] | 平均寿命[day] |
| 131I | 8.0207 | 0.08642 | 11.571 |
| 134Cs | 753.65 | 0.00092 | 1087.3 |
| 137Cs | 11012 | 6.29×10⁻⁵ | 15887 |
The environmental radiation information of the University of Tokyo
As an example of the time dependence of radiation dose rates, let’s consider the data from the University of Tokyo Environmental Radiation Information[16] published on the Internet. A hydrogen explosion occurred at 15:36 on March 12, 2011 at Unit 1 of the Fukushima Daiichi Nuclear Power Plant, a hydrogen explosion occurred at 11:01 on March 14, 2011 at Unit 3, and an explosion was heard at 06:10 on March 15, 2011 at Unit 2. A series of serious situations occurred.[11][12] The University of Tokyo data starts on March 15, 2011 and ends on December 25, 2011. There are two series of data for Kashiwa City, which has a high dose rate, from March 15 to May 13, 2011 (Tokyo University Kashiwa 1) and from May 10 to December 25, 2011 (Tokyo University Kashiwa 2). Looking at the data, the value was about 0.12 μSv/h until March 20, 2011, but it suddenly rose to about 0.75 μSv/h on March 21, 2011. This is because when the radioactive atmospheric plume that rose from the nuclear power plant moved south from the Ibaragi coast through Chiba from the night of the 21st to the early hours of the 22nd, it rained in the Kanto region and radioactive materials fell down.[17] Measurements at the University of Tokyo are carried out several times a day, so the daily average is taken, and Figure 5 shows the relationship between the natural logarithm of the air dose rate (in μSv/h) and the number of days elapsed. The data from Kashiwa 2, University of Tokyo, is almost a straight line, so from the slope of the approximated line, the decay constant is 0.000893 [1/day], and the half-life is ln(1/0.000893) = 775.9 days. Here, the half-life, decay constant, and average lifespan (1/λ) of radioactive iodine and radioactive cesium[18] are shown in Table 1. The half-life calculated from the University of Tokyo Kashiwa 2 data is very close to the half-life of 134Cs, which is 753.7 days, only about 22 days longer. In the measurement environment at the University of Tokyo, it is estimated that there are no artificial factors such as decontamination that reduce the dose rate, so the decrease in the air dose rate from May 10th to December 25th is thought to be mainly due to the radioactive decay of 134Cs.
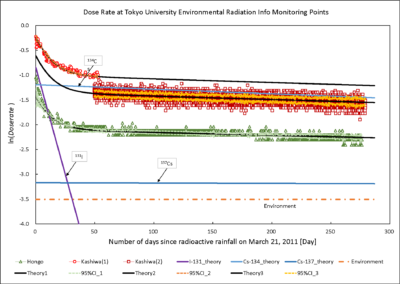
式2を使って計算した131I、134Cs、137Csによる放射線量率およびそれらの和と東大の測定値との時間依存特性[19]を図6に示します。式2のaN0の値は、核種ごとに正確には求められませんが、データに合うように調整して計算に使用した131I、134Cs、137Cs原子核数の割合は0.5 %、33.0 %、66.5 %です。東大測定されたデータはいずれも計算曲線によく一致します。このことから、初期30日位の大きい減衰は半減期が約8日と短い131I Iの崩壊、それ以降の緩やかな減衰は主に半減期が約2年の134Csの崩壊によると考えられます。
Time dependence of radiation dose rate at the root of Zelkova.
Figure 6 shows the natural logarithmic value of the detected and simulated dose rates as a function of number of days since the radioactive rainfall on March 21, 2011.[19] The simulated dose rates due to 131I, 134Cs, 137Cs and their sum were calculated using Eq. 2. Although the values of aN0 in Eq. 2 were not able to be obtained precisely for each nuclide, the proportions of 131I, 134Cs, and 137Cs nuclei used in the calculation after adjusting to fit the data were 0.5%, 33.0%, and 66.5%, respectively. All data measured at the University of Tokyo agreed well with the calculated curve. From this, it was thought that the significant decrease in the first 30 days was due to the radioactive decay of 131I with a half-life of about 8 days and that the slight decrease after that was mainly due to the radioactive decay of 134Cs with a half-life of about 2 years.
Zelkova in a park in Kashiwa City
柏市内の測定値, Measured values in Kashiwa city.
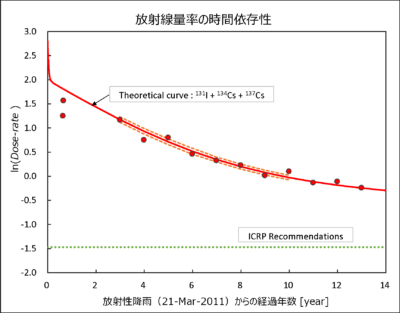
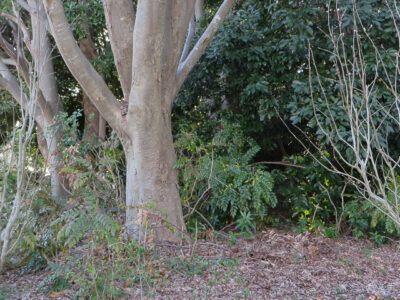
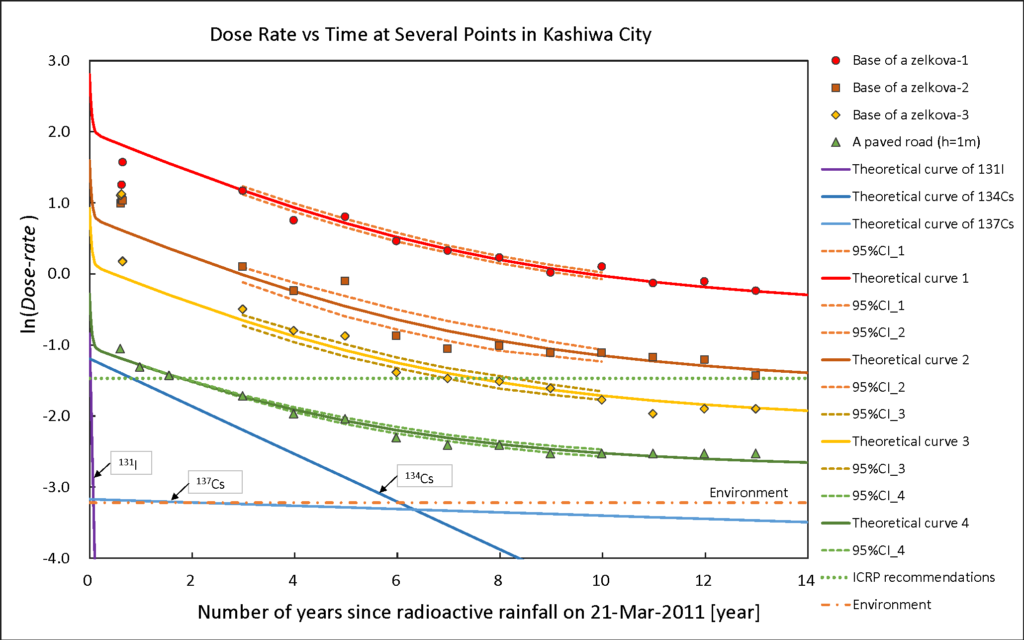
柏市周辺に放射性降雨のあった2011年3月21日から、定点観測した1例を図7に示します。この場所は、柏の葉公園のケヤキの木の根元です。図8に示したケヤキの木は広く枝を広げ、樹皮は滑らかなので、枝で集められた放射能汚染された雨が効率よく根元に流れ地表にしみ込んだのでホットスポットになったのです。
丸印のデータと理論曲線は、自然の対象物を測定したにしては驚くほど良い一致です。理論曲線は、放射性ヨウ素131I、放射性セシウム134Cs、放射性セシウム137Csの出す放射線量率の和です。放射性ヨウ素の半減期は8.02日と短いので初期の特性だけに影響します。それから5年位の間は半減期が2.06年の放射性セシウム134が寄与します。それ以降は半減期が30.2年の放射性セシウム137が寄与[13]します。放射性降雨から13年経った時点では放射性セシウム137の放射能が測定されている現状です。ちなみに、このケヤキの木の根元の放射線量率が安全基準目安の0.23μSv/hにまで減少するのは2078年になります。この場所の土を取り除いて安全な場所に保存する除染を行わなければ理論通りに経過し、放射性降雨から65年後にようやく安全基準値になると言うことです。
Measured values in Kashiwa city
Figure 7 shows an example of fixed-point observation from March 21, 2011, when there was radioactive rain around Kashiwa City. This location is at the base of the zelkova tree in Kashiwanoha Park. Zelkova trees have wide branches and smooth bark as shown in Fig.8, so radioactive rain collected by their branches efficiently flows to the roots and soaks into the ground, creating a hotspot. The data marked with circles and the theoretical curve match surprisingly well for a natural object measured. The theoretical curve is the sum of the radiation dose rates emitted by radioactive 131I, 134Cs, and 137Cs. Radioactive Iodine has a short half-life of 8.02 days, so it only affects its initial properties. For about 5 years thereafter, radioactive Cesium-134, which has a half-life of 2.06 years, will contribute. After that, radioactive Cesium-137, which has a half-life of 30.2 years, contributes [13]. As of 13 years after the radioactive rain, radioactivity of radioactive Cesium-137 has been measured. By the way, it will be in 2078 that the radiation dose rate at the base of this zelkova tree will be reduced to 0.23 μSv/h, which is the safety standard guideline. Unless decontamination is carried out by removing the soil from this area and storing it in a safe place, the situation will pass according to the theory, and the safe standard value will finally be reached 65 years after the radioactive rain.
おわりに, Closing comment
柏市周辺に放射性降雨のあった2011年3月21日から、定点観測した4例を図9に示します。この程度の放射線量率であれば、放射能の性質を知ったうえで測定も可能です。放射能がはるかに強い福島第一原子力発電所の廃炉作業を考えると、その困難さは想像を絶するものです。人間が近づくことすらできないからです。ロボット機器を使って強い放射能を放つデブリなどを取り出したら、それを安全に封入して安全な場所に保管しなければなりません。時間を事故以前に戻すことはできない以上、現に起こったことに知恵を働かせて対処しなければなりません。そして、他の全ての原子炉で同じような事故が起こることを防がなければなりません。日本列島はリング・オブ・ファイアの一環にあり自然災害が多い、そのことに十分な施策を考えておかなければなりません。
Closing comment
Figure 9 shows four examples of fixed-point observation from March 21, 2011, when there was radioactive rain around Kashiwa City. If the radiation dose rate is at this level, it is possible to measure it after knowing the nature of radioactivity. The difficulty of decommissioning the Fukushima Daiichi Nuclear Power Plant, which is far more radioactive, is unimaginable. Because humans can’t even get close to it. Once robotic equipment is used to remove debris that emits strong radioactivity, it must be safely sealed and stored in a safe location. Since we cannot turn back time to what happened before the accident, we must use our wisdom to deal with what actually happened. And we must prevent similar accidents from happening at all other nuclear reactors. The Japanese archipelago is part of the Ring of Fire and is prone to natural disasters, so we need to take adequate measures into account.
References
[12] Report submitted to the IAEA by the Government of Japan, June 2011. https://www.kantei.go.jp/jp/topics/2011/iaea_houkokusho.html
[13] 放射性物質による局所的汚染箇所への対処ガイドライン, 環境省. https://www.env.go.jp/content/900483790.pdf
[14] 千葉県柏市で発見された周辺より放射線量の高い場所に関する詳細調査報告書, 環境省. https://www.env.go.jp/press/files/jp/18940.pdf
[15] ICRP Publication 103, 国際放射線防護委員会の2007年勧告. https://www.icrp.org/docs/P103_Japanese.pdf
[17] H. Yamazawa and S. Hirao, Environmental influence through air by the Fukushima nuclear disaster, Proceedings of the Japanese nuclear Association, Vol. 53, No. 7, 2011.
[18] Japan Atomic Energy Agency, Tables of Nuclear Data. https://wwwndc.jaea.go.jp/NuC/index.html